How to read the data source of my chart from the field of gridview
I want to set the source of chartjs from the ExFilePath of the gridview (that get data from SqlDataSource)
I have a gridview that read some data from SqlDataSource and also it has a LinkButton to show some charts. I set the path for chartjs in my code. But now I want to select the path from the current row (ExFilePath field ).
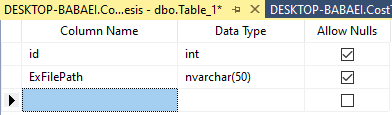
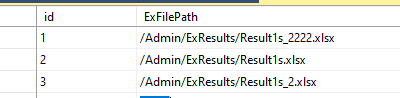
this is my DB:
this is my code:
<asp:GridView ID="GridView1" runat="server" AutoGenerateColumns="False" DataSourceID="SqlDataSource1">
    <Columns>
        <asp:BoundField DataField="id" HeaderText="id" SortExpression="id" />
        <asp:BoundField DataField="ExFilePath" HeaderText="ExFilePath" SortExpression="Excel FilePath" />
        <asp:TemplateField>
            <ItemTemplate>
                <asp:LinkButton ID="lnkShowChrt" Text="ShowCharts" CommandArgument='<%# Bind("Container.DataItemIndex") %>' runat="server" />
            </ItemTemplate>
        </asp:TemplateField>
    </Columns>
</asp:GridView>
<asp:SqlDataSource ID="SqlDataSource1" runat="server" ConnectionString="<%$ ConnectionStrings:CostThesisConnectionString %>" SelectCommand="SELECT * FROM [Files]"></asp:SqlDataSource>
<div class="container">
     <br>
     <div class="row">
         <div class="col-xl-6 col-lg-6 col-md-12 col-sm-12">
             <canvas id="MonthlyCost"></canvas>
         </div>
     </div>
 </div>
 <script src="https://cdnjs.cloudflare.com/ajax/libs/jquery/3.4.0/jquery.slim.min.js"></script>
 <script src="https://cdnjs.cloudflare.com/ajax/libs/twitter-bootstrap/4.3.1/js/bootstrap.min.js"></script>
 <script src="https://cdn.jsdelivr.net/gh/google/code-prettify@master/loader/run_prettify.js"></script>
 <script src="https://cdn.jsdelivr.net/npm/chart.js@2.8.0"></script>
 <script src="https://cdn.jsdelivr.net/npm/xlsx@0.14.3/dist/xlsx.full.min.js"></script>
 <script src="https://cdn.jsdelivr.net/npm/chartjs-plugin-datasource"></script>
 <script src="JS/MonthlyCost.js"></script>
 <script>
     window.onload = function () {
         var ctxMonthCost = document.getElementById('MonthlyCost').getContext('2d');
         window.MonthlyCost = new Chart(ctxMonthCost, MonthlyCostConfig);
     };
 </script>
MonthlyCost.js
var MonthlyCostConfig = {
    type: 'bar',
    data: {
        datasets: [{

            barPercentage: 0.5,

            backgroundColor: 'rgb(196, 230, 255)',
            borderColor: 'transparent',
            borderWidth: 1
        },
        ]

    },
    plugins: [ChartDataSource],
    options: {
        //maintainAspectRatio :false,
        legend: { display: true },
        title: {
            display: true,
            text: 'Monthly Cost'
        },

        scales: {
            xAxes: [{
                scaleLabel: {
                    display: true,
                    labelString: 'Month'
                }
            }],
            yAxes: [{
                scaleLabel: {
                    display: true,
                    labelString: 'Value'
                }
            }]
        },
        plugins: {
            datasource: {
                type: 'sheet',
                url: '',
                rowMapping: 'index',
                datasetLabels: 'Monthly Cost!B2',
                indexLabels: 'Monthly Cost!A3:A',
                data: 'Monthly Cost!B3:B'
            }
        }
    }
};
how can I do this?!