Hi rani,
Using the below article ia have created the example.
Check this example. Now please take its reference and correct your code.
HTML
<html xmlns="http://www.w3.org/1999/xhtml">
<head runat="server">
    <title></title>
    <style type="text/css">
        body
        {
            font-family: Arial;
            font-size: 10pt;
        }
        #chart
        {
            width: 900px;
            height: 500px;
        }
        #chart span
        {
            color: red;
            font-size: 8pt;
            font-style: italic;
        }
        #chart img
        {
            height: 50px;
            width: 50px;
        }
    </style>
    <script type="text/javascript" src="https://ajax.googleapis.com/ajax/libs/angularjs/1.0.7/angular.js"></script>
    <script type="text/javascript" src="https://www.gstatic.com/charts/loader.js"></script>
    <script type="text/javascript">
        google.charts.load('current', { packages: ['orgchart'] });
        var app = angular.module('MyApp', []);
        app.controller('MyController', ['$scope', '$http', function ($scope, $http) {
            $scope.chartData = [['Name', 'ReportsTo', 'tooltip']];
            $http.post('Default.aspx/GetChartData', { headers: { 'Content-Type': 'application/json'} })
            .then(function (response) {
                var newobject = [['Entity', 'ParentEntity', 'ToolTip']];
                angular.forEach(response.data.d, function (val) {
                    var employeeId = val.EmployeeId.toString();
                    var employeeName = val.Name;
                    var designation = val.Designation;
                    var reportingManager = val.ReportingManager != null ? val.ReportingManager.toString() : '';
                    newobject.push([{
                        v: employeeId,
                        f: employeeName + '<div>(<span>' + designation + '</span>)</div><img src = "Pictures/' + employeeId + '.jpg" />'
                    }, reportingManager, designation]);
                });
                var chart = new google.visualization.OrgChart(document.getElementById("chart"));
                var data = google.visualization.arrayToDataTable(newobject);
                var options = { 'title': '', 'allowHtml': true }
                chart.draw(data, options);
            })
        } ]);
    </script>
</head>
<body ng-app="MyApp" ng-controller="MyController">
    <form id="form1" runat="server">
    <div id="chart">
    </div>
    </form>
</body>
</html>
Code
C#
[System.Web.Services.WebMethod]
public static List<EmployeesHierarchy> GetChartData()
{
    using (TestEntities entities = new TestEntities())
    {
        return entities.EmployeesHierarchies.ToList();
    }
}
VB.Net
<System.Web.Services.WebMethod()>
Public Shared Function GetChartData() As List(Of EmployeesHierarchy)
    Using entities As TestEntities = New TestEntities()
        Return entities.EmployeesHierarchies.ToList()
    End Using
End Function
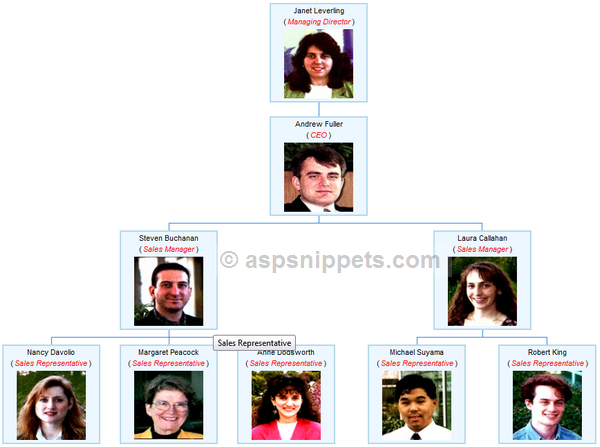
Screenshot